Using Data Sets API with Python
Exerica API extracts data from thousands of corporate publications to deliver automatically constructed data sets. It accepts any datapoint in a publication as an input, and returns the best matches (i.e. data points with the same meaning and context) in other documents sourced from the same publisher.
Data presented this way can have a significant impact for financial analysis, risk management and quantitative analysis in particular, enabling comparisons over time and across sectors. One of the simplest and most common is the correlation between two different data sets (eg. a company Net Profit over a number of years, or maybe a comparison of a number of company Net Profits in a particular year). This task would literally come down to a few lines of code if you use Exerica Data Sets API. Below, I will show how to do it in Python.
For example let’s calculate the correlation between customers numbers of two US telecom operators: T-Mobile US and Consolidated Communications.
Using the Exerica web application and the embedded PDF viewer to find the relevant data points is very straightforward. Look up T-Mobile using the Company Search control, then open any company publication in the Reports tab. That said, we would recommend working the last available company report – which would currently be 3Q2020 for T-Mobile.
Use the Search panel on the right hand side to find all data points including the word customers in the report.
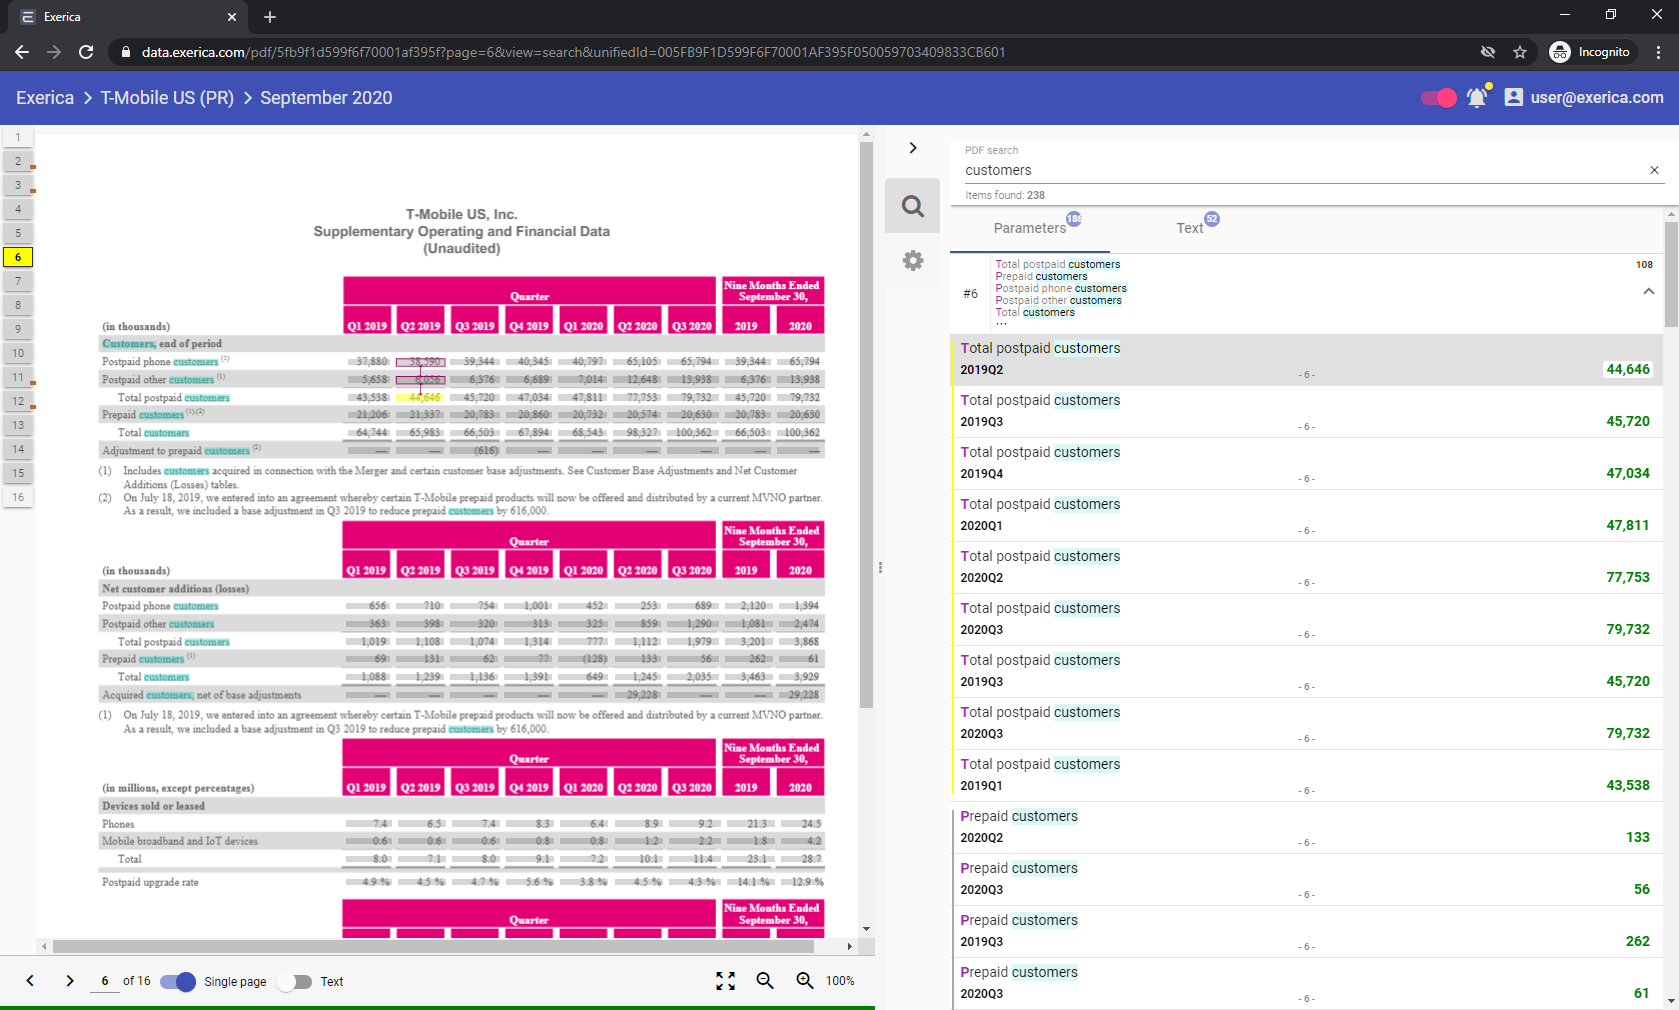
Select the correct one and copy and save its ID.
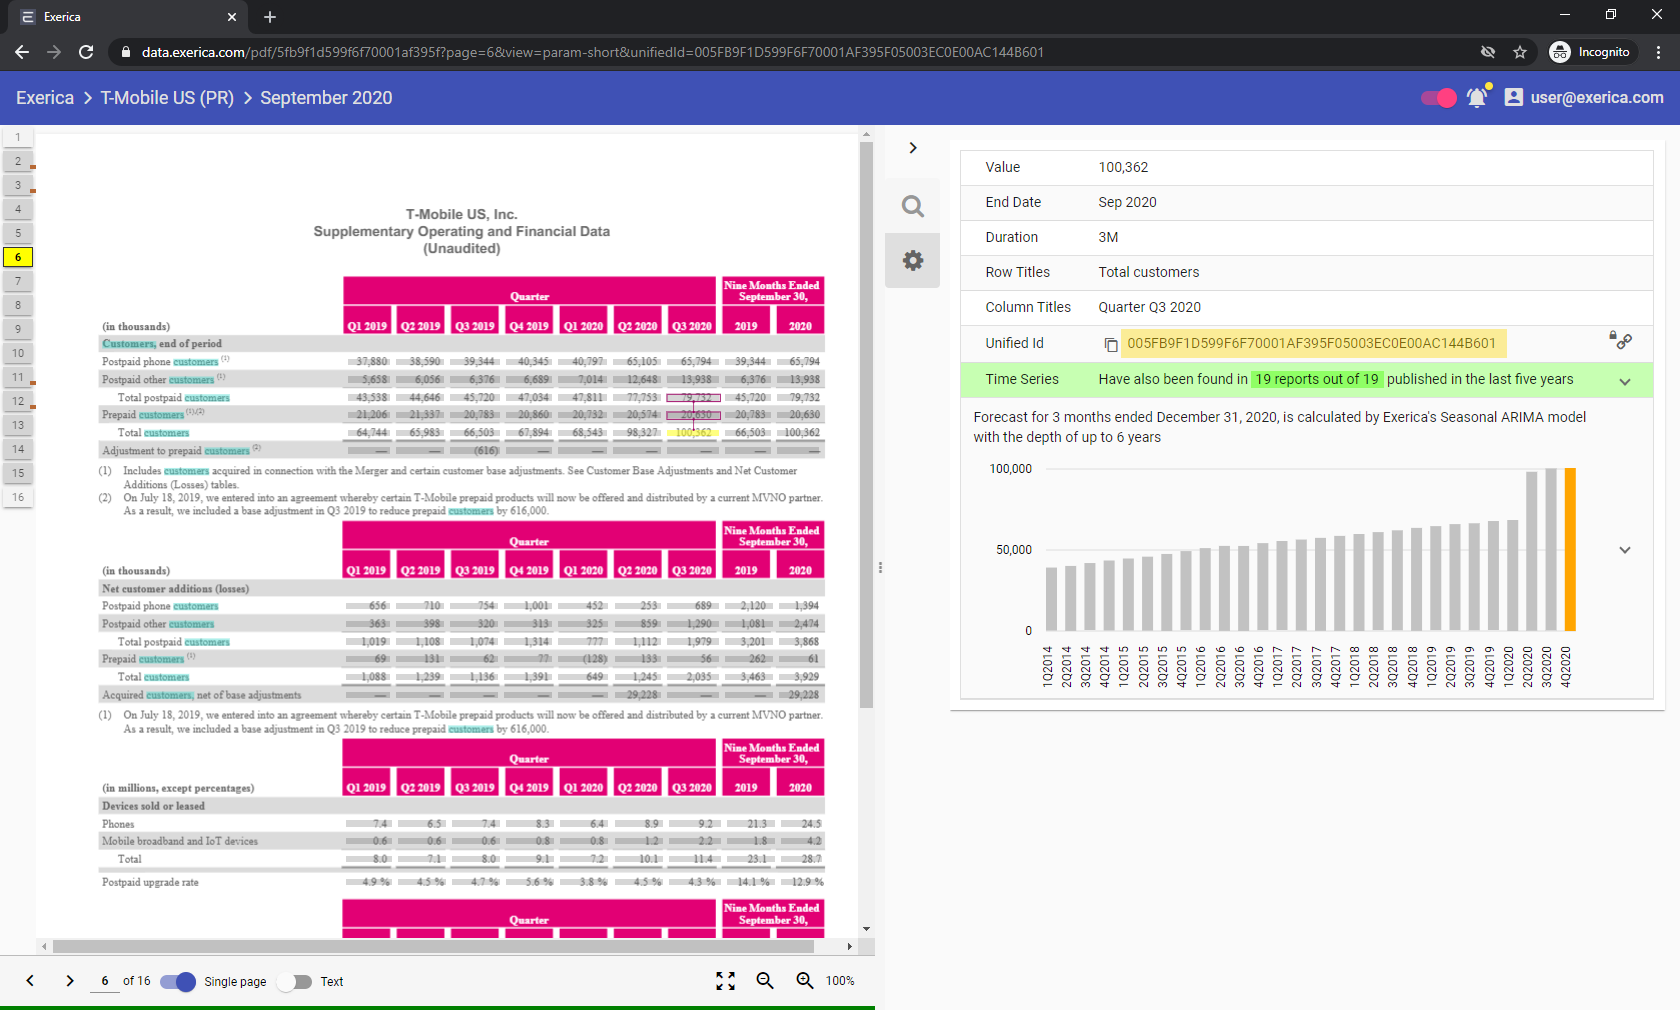
Then we do the same for Consolidated Communications. These are the data points we have found: one and two.
First, we use the saved data point IDs to get the full time series for each. We use the requests library to access the API and pandas to deal with data sets. The getTimeSeries() function below loads a time series by data point ID and converts it to the pandas Series:
  def getTimeSeries(uid):
    r = requests.get(
      "https://api.exerica.com/api/DataSets/" + uid,
      headers={"APIKEY": "paste-your-api-key-here"})
    values = [p["value"] for p in r.json()]
    dates = [p["endDate"] for p in r.json()]
    ts = pd.Series(values, index=dates, name=uid[-6:])
    return ts
Using this function we can load the data for both time series by data point ID:
  ts1 = getTimeSeries("005FB9F1D599F6F70001AF395F05003EC0E00AC144B601")
  ts2 = getTimeSeries("005FB7C5B2F4CF88000156434225001B70950C6829D001")
Print them horizontally to check the loaded data:
  print(ts1.to_frame().T)
  print(ts2.to_frame().T)
Also, we should align indices of the data sets (the first one is chosen as base for alignment):
ts2 = ts2.reindex(ts1.index)
This enables us to compute correlation with a 2-year rolling window, print it and plot to a chart:
  corr = ts1.rolling(8).corr(ts2).dropna()
  print(corr.to_frame().T)
  plt.plot(corr)
  plt.xticks(rotation=90)
  plt.show()
Putting it all together:
  import requests
  import pandas as pd
  import matplotlib.pyplot as plt

  def getTimeSeries(uid):
    r = requests.get(
      "https://api.exerica.com/api/DataSets/" + uid,
      headers={"APIKEY": "paste-your-api-key-here"})
    values = [p["value"] for p in r.json()]
    dates = [p["endDate"] for p in r.json()]
    ts = pd.Series(values, index=dates, name=uid[-6:])
    return ts

  ts1 = getTimeSeries("005FB9F1D599F6F70001AF395F05003EC0E00AC144B601")
  ts2 = getTimeSeries("005FB7C5B2F4CF88000156434225001B70950C6829D001")

  print(ts1.to_frame().T)
  print(ts2.to_frame().T)

  ts2 = ts2.reindex(ts1.index)
  corr = ts1.rolling(8).corr(ts2).dropna()
  print(corr.to_frame().T)

  plt.plot(corr)
  plt.xticks(rotation=90)
  plt.show()
If you would like to use this code, don’t forget to paste your API key to the request headers replacing ‘paste-your-api-key-here’.
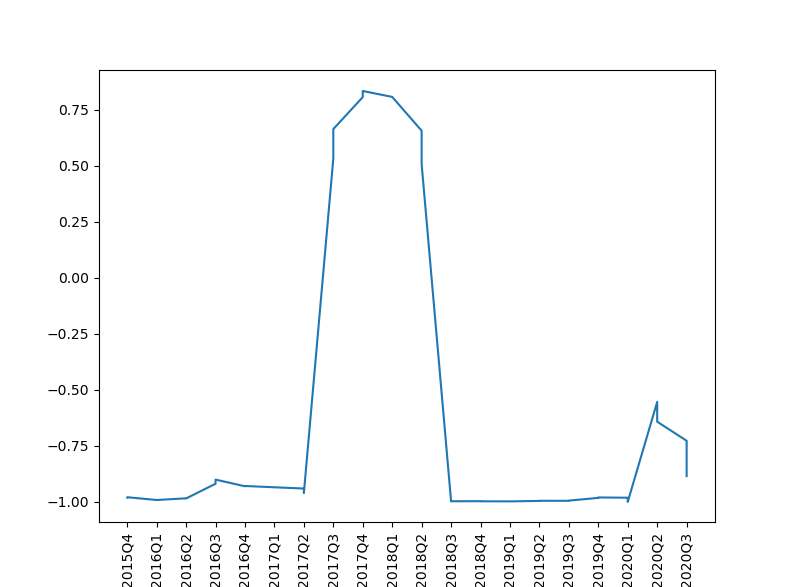
As we can see, the correlation between T-Mobile US and Consolidated Communications number of customers is close to -1 for nearly the entire period being looked at (except the year between 3Q 2017 to 2Q 2018). This type of negative relationship between the number of customers of the two telecom companies can be interpreted as one driven by competition between them. In other words, a loss of customers by one company appears closely related to an increased number of customers for the other.