Exerica PDF Viewer
The Exerica PDF viewer enables you to view and work with original company publications together with the analytical layer created by Exerica AI. The analytical layer contains meta data describing the meaning and context of each numerical data point in the document. All data points that have been detected and analysed by Exerica AI will be part of the analytical layer.
Default document view
The work area for the default view includes a document pane in the middle, a page navigation pane on the left and the analytics pane on the right (hidden by default). The document pane displays reports and implements the functionality of a basic PDF viewer. The page navigation pane on the left side helps you browse through the report and highlights pages containing data points in grey. The analytics pane on the right is described below in detail.
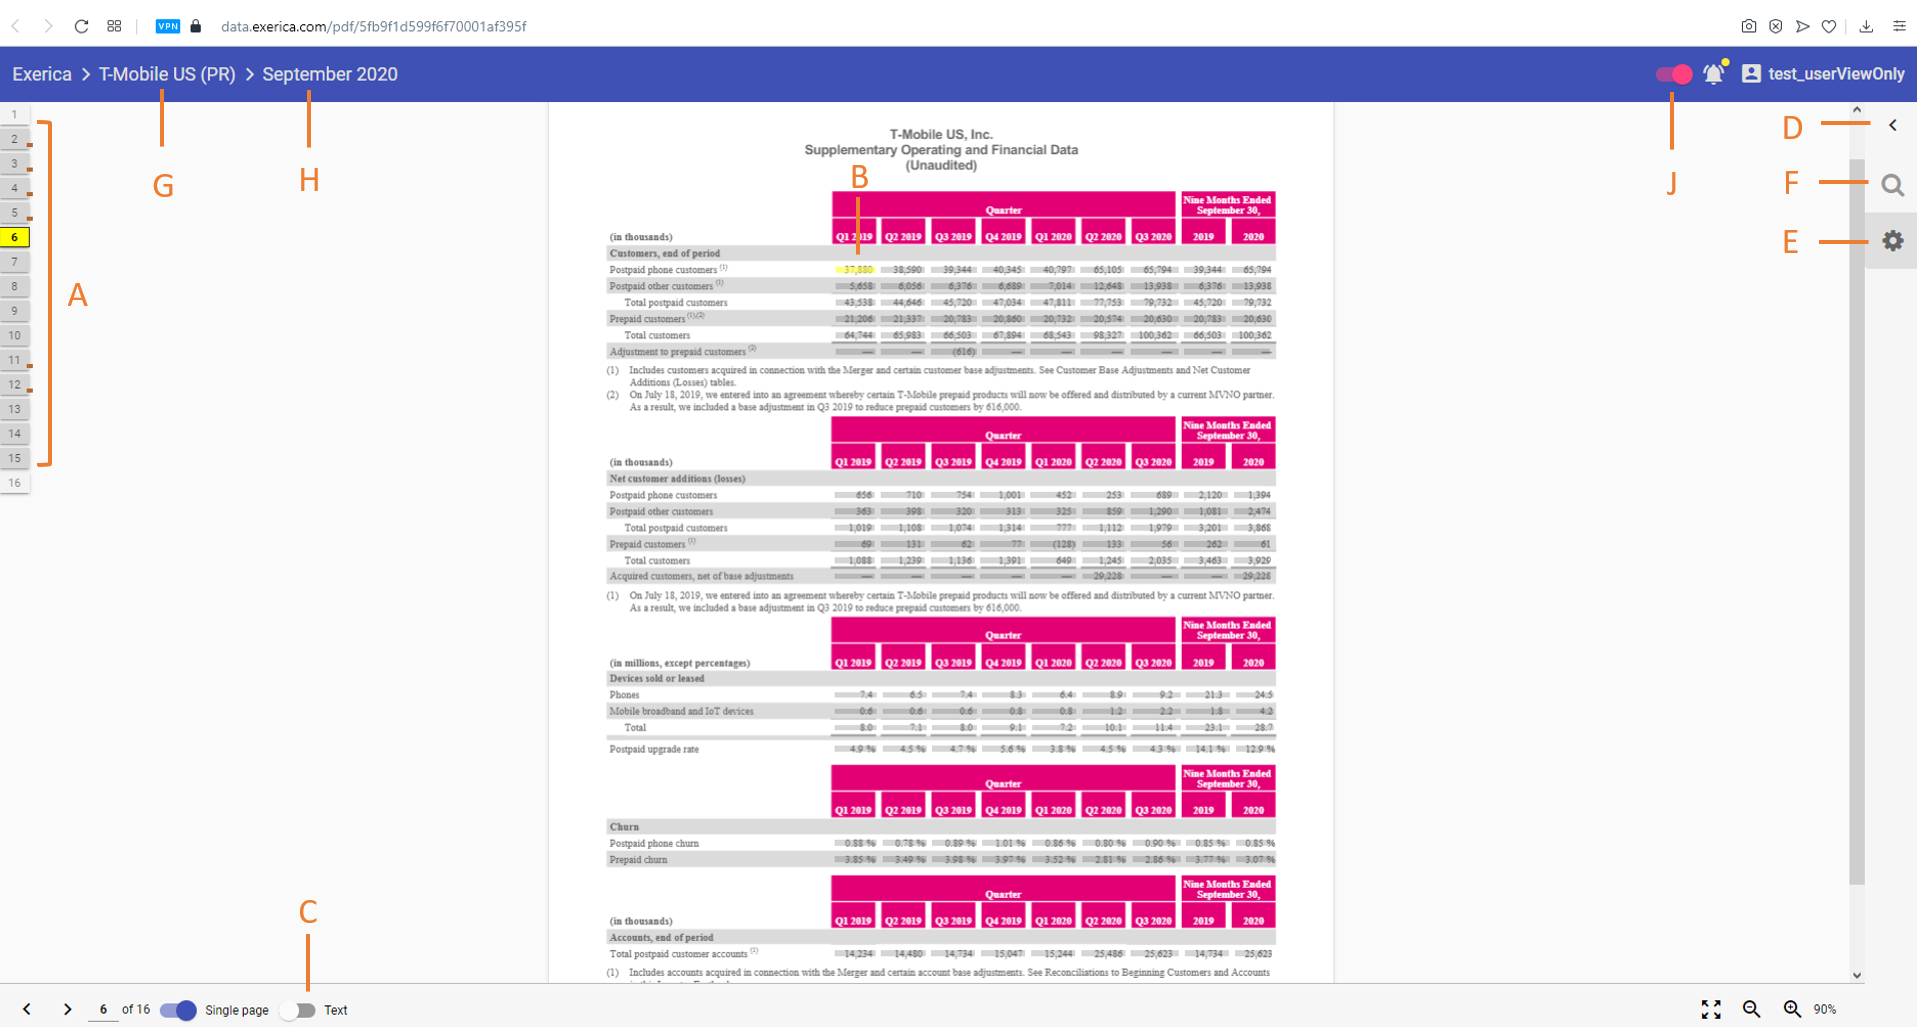
A. Page navigation pane displays the list of all pages in the document and highlights pages with detected data points in grey for easy access.
B. Selected data point. All data points detected on a page are highlighted in grey or light red colors. Selected data points are highlighted in yellow.
C. Text layer switch is off by default. This means that the text layer of the original document is replaced with the Exerica analytical layer making access and data point manipulations easier. Use this switch if you want to remove the analytical layer and work with the document in the text layer regime (as you would normally do in any basic PDF viewer)
D. Collapse/Expand button for the right pane
E. Data point analytics view
F. Data point search view
G. The name of the company and the publication type (in brackets)
H. The reporting date of the publication
J. Connection to Excel switch is on by default
Data point analytics
Data point analytics can be accessed by clicking the ‘gear’ button on the right pane. This regime displays the key information describing the meaning and context of the selected data point, including its value, date, duration, key textual attributes, its Unified ID and the entire data set.
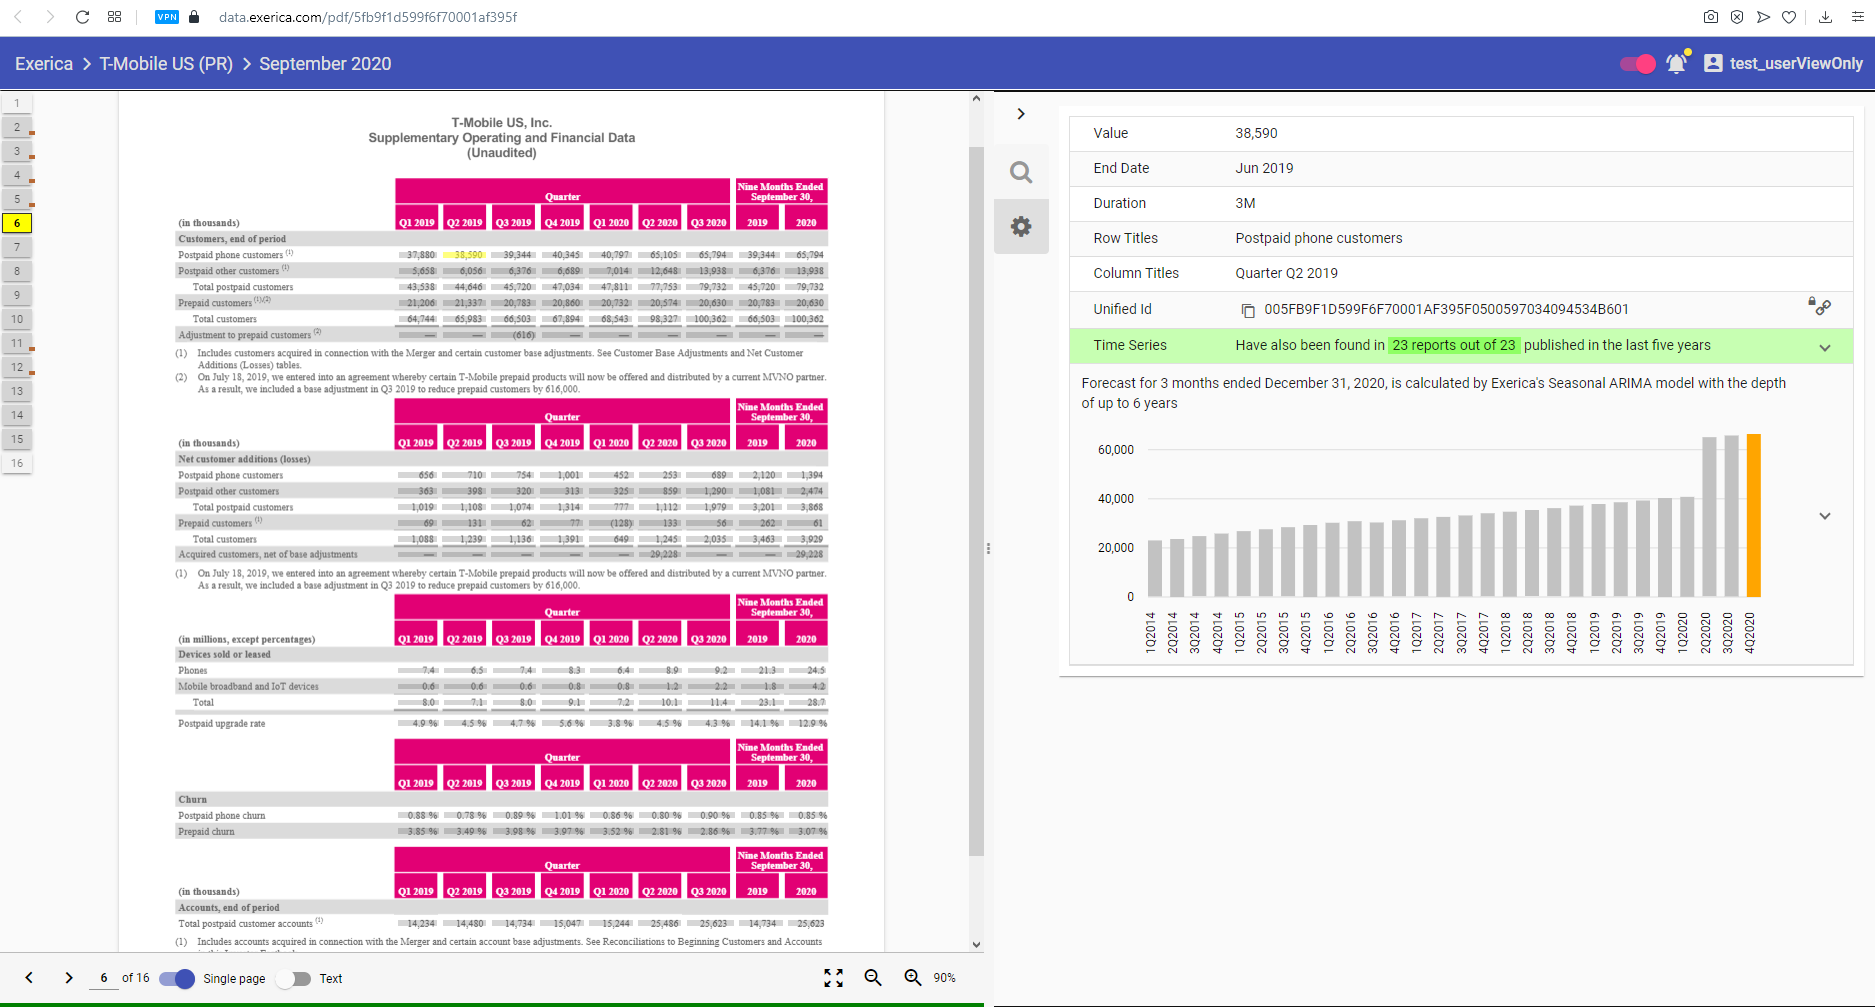
Value is the value of the data point as it is presented in the document
End date is the date of the data point as identified by the Exerica AI in the tabular structure and broader context on the page and in the entire document. See our DateParser for more detail on the core algorithms
Duration is a number of months in periodic dates like “three months ending 31 December”.
Row and Column titles include text attributes of the data point according to the tabular structure as identified by Exerica AI.
Unified ID is the unique ID of the data point which can be used in the Excel plug-in and in Data Sets API to get the full data set which the current data point is part of.
Time series contains the full automatically-built data set which the current data point is part of. The data set is composed of the data points in the other reports published by the same entity which Exerica AI has identified as having the same meaning and context.
Projections – Exerica employs machine learning and other statistical methods to analyse the vast amounts of structured corporate data available in our database and to make projections of how data sets are likely to evolve in future. The projection for the selected data set is displayed on the chart at the bottom of the ‘Data point analytics’ view.
