Exerica Nuggets – The curious case of Lippo Malls Retail Trust
It is not uncommon for Exerica AI to discover references and anomalies in data which are not immediately visible to a human reader. These vary from major accounting items reported with errors (with numbers simply not adding up) to more mysterious cases involving data accidently left by accountants in the PDF documents. Such anomalies are discovered automatically by the Exerica core AI, as it extracts all data and analyses dependencies between data points to recover the original accounting structure from documents.
Most data anomalies come down to accounting mistakes and hidden restatements, which often indicate poor accounting work and tend to correlate negatively with the company’s financial health.
Another type of data anomaly is caused by the complex process of PDF document creation which sometimes results in the PDF printer capturing data the publisher did not intend to include in the final document. Such information, particularly in unaudited releases, can sometimes contain data which was only intended to be identifiable in the original Excel file for management accounts and calculations.
——–
In the case of Lippo Malls Indonesia, Exerica has found additional sets of figures in the company’s releases for Q1 2020 and Q1 2019 – all are hidden from a human eye. Exerica AI has extracted them together with the visible numbers but struggled to interpret them as a simple restatement, and flagged what it sees as a data integrity issue.
Most notably, the Cash Flows statement contains two sets of numbers for Q1 2020 which are different for a few items, including bottom-line Cash & Cash Equivalents at both the beginning and the end of the reporting period. The difference appears to arise from different values for “Other assets” as well as from the difference in the starting cash balances, whereas most other items are the same. The hidden figures form a consistent accounting structure (i.e. the numbers add up and are mathematically correct, which was the primary reason why Exerica identified them as a major anomaly). This also suggests that these probably represent some meaningful calculations in the original management accounts.
The same reporting phenomenon also occurs in the company’s Q1 2019 report. The hidden set of cash flows is different from the visible one in terms of “Other assets” and the beginning and the ending cash balances.
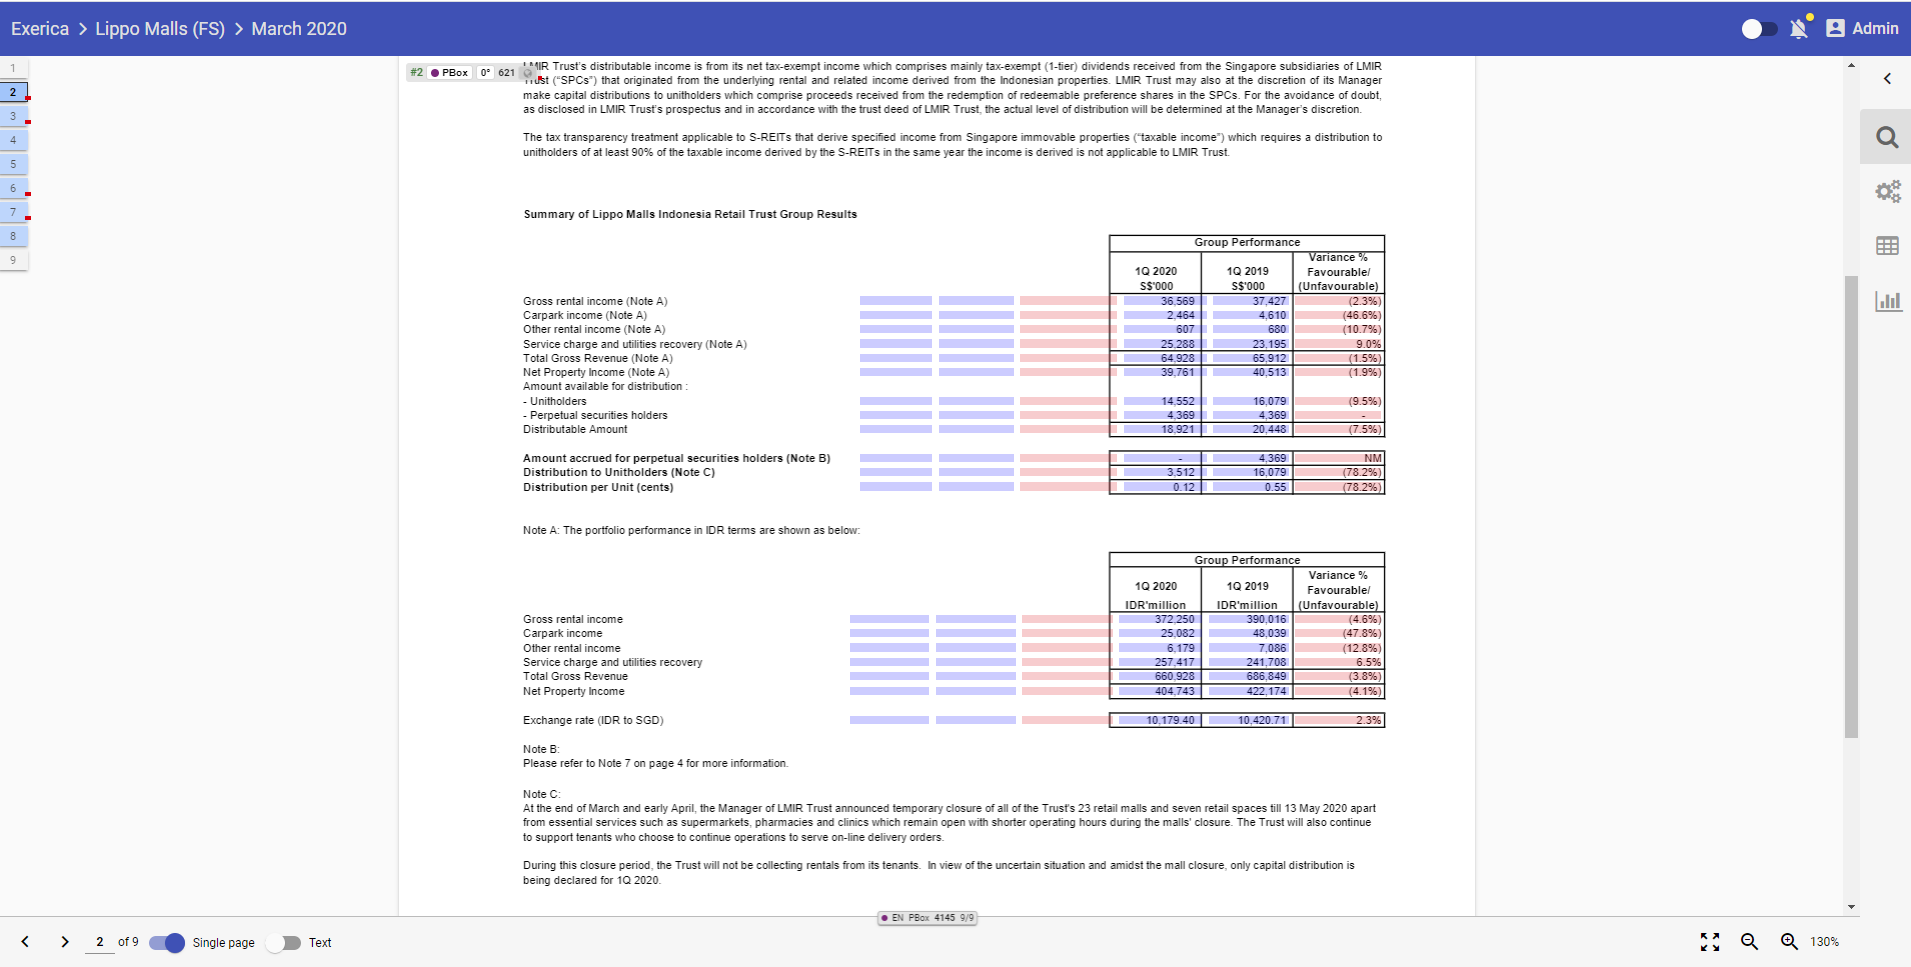
Other scraps of data are less consistent, with various disclosures of the Income Statement containing references to, and comparisons with, the previous periods (Q4 2017 in most cases) which are sometimes slightly different from the reported numbers. These include ‘Distribution per Unit (cents)’ which had been reported at 0.79 initially but appears to have been revised down to 0.78 in 2019 and 0.77 in 2020. Exerica AI has identified these three as data points with the same meaning, context and reporting date with a high level of confidence.
Finally, ‘The portfolio performance in IDR terms’ contains significant negative adjustments next to each revenue item as well as Net property Income, which increased in the Q1 2020 report compared to the Q1 2019.
Analysts interested in analyzing these publications further can download them here: Lippo Malls 1Q (reprinted)